


Most businesses check their rankings and call it SEO reporting. But rankings tell only a fraction of the story.
A page can rank in position three and bring almost no visitors. Another page can generate thousands of visitors and produce zero leads. A third page might convert beautifully but never show up for the keywords that matter. Rankings alone cannot explain any of that.
That is where SEO KPIs come in.
SEO KPIs help you understand what is happening at every stage of your search performance. They show whether your website is becoming more visible, attracting more visitors, earning backlinks, engaging users, generating leads, and ultimately producing revenue. In 2026, a complete set of SEO KPIs also includes how your brand appears in AI-powered search platforms like Google AI Overviews, ChatGPT, and Perplexity.
This guide covers all 30 SEO KPIs. For each one, you will learn what it means, why it matters, how to check it, and how to use it for real decisions. Whether you manage your own SEO or work with an agency, this guide will help you track the numbers that actually matter.
What Are SEO KPIs?
SEO KPIs are measurable indicators that tell you whether your search optimization efforts are moving you toward specific goals. The abbreviation KPI stands for Key Performance Indicator.
These indicators can cover multiple areas of search performance, including:
- Organic rankings and visibility
- Search impressions and click-through rates
- Website traffic from unpaid search
- Content engagement and conversions
- Backlinks and referring domains
- Technical site health
- AI search visibility and citations
- Revenue and return on investment
The key word in KPI is key. You are not trying to track every possible number. You are identifying the metrics that most directly reflect whether your SEO is achieving your business goals.
For example, a Houston auto repair shop might care most about phone calls, direction requests, and local map pack visibility. A Houston law firm might focus more on organic leads, branded search volume, and organic conversion rate. A local ecommerce business might prioritize organic revenue and non-branded traffic. The right KPI set reflects your specific business model and goals.
SEO Metrics vs SEO KPIs
Every KPI is a metric. But not every metric is a KPI.
A metric is simply something you can measure. Your website might receive 25,000 organic sessions, 150,000 impressions, 3,200 clicks, and 180 leads in a given month. All four numbers are useful metrics.
If your primary business goal is generating leads, however, organic leads and organic conversion rate deserve more attention than raw session volume. Those two become your KPIs because they connect directly to your goal.
This distinction keeps your SEO reporting focused and useful. A report filled with 50 vanity metrics is harder to act on than a report built around 8 meaningful indicators. Choose metrics that help you make decisions. That is what makes a metric a KPI.
Our SEO services include monthly KPI reporting built around your specific business goals, not generic templates that look impressive but reveal nothing actionable.
Section 1: Search Visibility KPIs
1. Organic Search Visibility
Organic search visibility measures how prominently your website appears in unpaid search results overall. Instead of tracking a single keyword, it gives you a broader view of your entire search presence.
Your website might rank for hundreds of different keywords. Some appear in the top three positions. Others show up on page two or three. Organic search visibility helps you understand whether that overall presence is growing, holding steady, or declining.
This KPI matters because it can show SEO progress before you see a major spike in traffic. Your impressions and rankings typically improve first. Traffic and conversions follow.
Here is a real-world example. An auto repair website initially ranks in the top 10 for 15 important keywords. Six months of consistent SEO work later, it ranks in the top 10 for 42 keywords. That improvement in visibility is a clear leading indicator of traffic and lead growth to come.
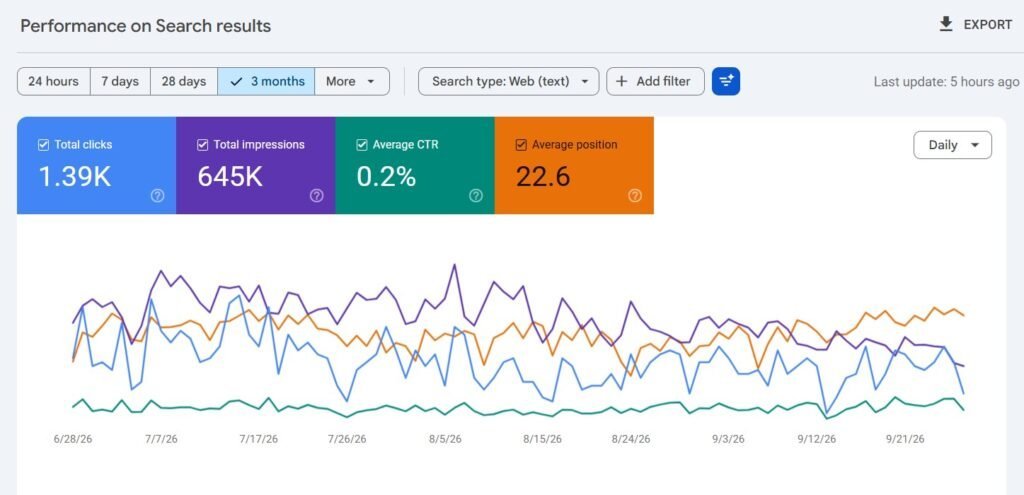
How to check it:
- Open Google Search Console and go to Performance, then Search results.
- Review total impressions, clicks, average CTR, and average position.
- For keyword-specific visibility, use Ahrefs or Semrush to track a defined keyword set over time.
2. Keyword Rankings
Keyword rankings show exactly where your website appears in search results for specific queries. If your brake repair page moves from position 18 to position 7 for “brake repair Houston,” that movement is directly visible and measurable.
Rankings help you identify your strongest pages, declining content, new keyword opportunities, and the direct impact of specific optimizations.
That said, rankings should never be viewed in isolation. A keyword ranking at position two with no monthly search volume creates no business value. Connect rankings with impressions, clicks, traffic, and conversions to understand their real impact.
How to check it:
- Use Google Search Console, then go to Performance, then Queries
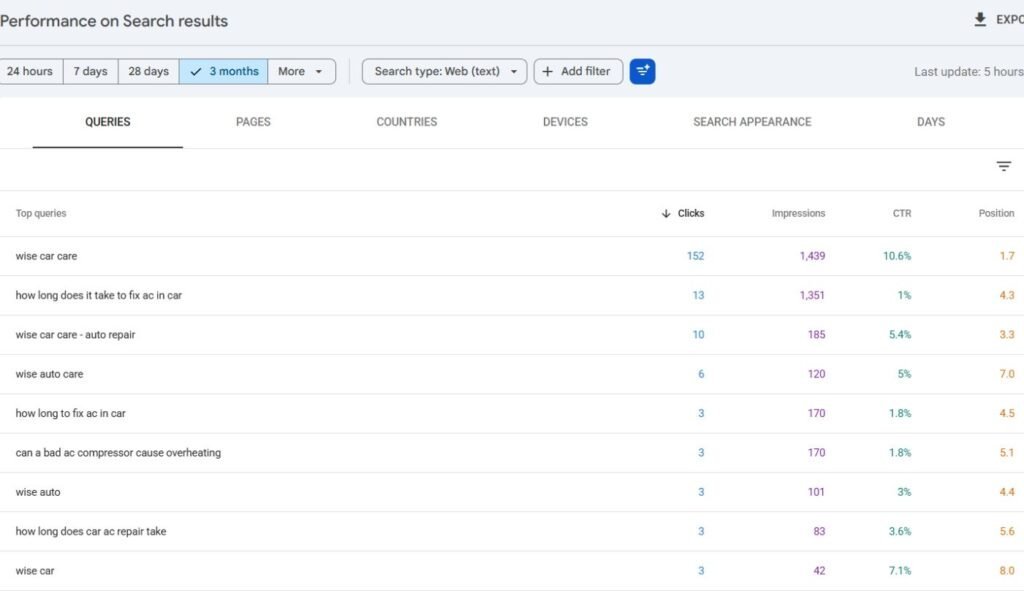
- For a dedicated tracking experience with historical data, use a rank tracking tool such as Ahrefs, Semrush, or Moz.
Practical tracking example for a Houston auto repair shop:
- “auto repair Houston”
- “brake repair near me”
- “oil change Katy TX”
- “BMW service Houston”
Record positions weekly and look for trends over 30- to 90-day periods.
3. Search Impressions
Search impressions measure how many times your website appeared in search results during a given period. An impression does not require a click. It simply means your page was displayed to a searcher.
Impressions are valuable because they show raw search exposure. A page with thousands of impressions but very few clicks is telling you something important. Either it ranks too low for clicks to happen, or its title and meta description are not compelling enough to earn them.
How to check it:
- Open Google Search Console, then go to Performance, then Search results.
- Select Total Impressions.
- Compare date ranges and filter by query, page, device, or country for deeper analysis.
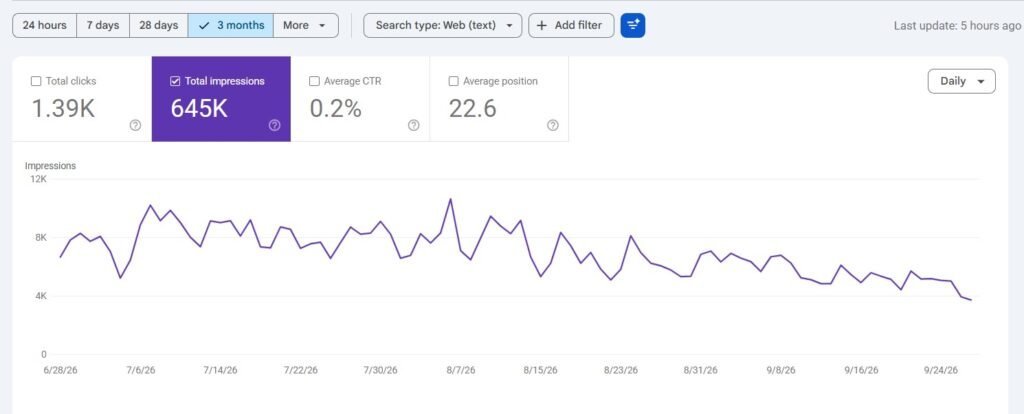
A service page with 80,000 impressions but only 400 clicks has a CTR of 0.5%. That number alone warrants a review of the page’s title tag, meta description, ranking position, and alignment with search intent.
4. Share of Search
Share of search measures how much of the available search visibility your website captures compared with your competitors across a specific keyword set.
Rankings tell you where you sit. Share of search tells you how much of the market you own.
This KPI is especially useful for local service businesses competing against a defined set of local competitors. A Houston plumbing company can track its visibility share against the three or four other plumbing companies dominating the map pack. That comparison reveals exactly how much ground you have, or have not, gained.
How to check it:
- Define a fixed keyword set of your most important commercial terms.
- Track your rankings and competitor rankings using an SEO platform.
- Calculate your percentage of top-10 appearances across that keyword set.
- Run the same calculation monthly using the same keyword list for consistent comparisons.
5. SERP Feature Visibility
Google search results now include far more than traditional blue links. Features appearing in search results can include:
- Featured snippets that appear above all organic results
- People Also Ask boxes with expandable question and answer sections
- Local packs showing three local business listings with a map
- Image packs and video carousels
- Knowledge panels for brands and entities
- Shopping results for product-related queries
SERP feature visibility tracks whether your website appears in these elements, not just the standard organic listings.
Owning a featured snippet for a high-volume query can deliver more traffic than ranking in position three for the same query. Local pack appearances for service-related queries are essential for every Houston area service business.
How to check it:
- Use Ahrefs or Semrush to identify which SERP features your target keywords trigger.
- Monitor whether your website captures any of those features.
6. Top 3 and Top 10 Keyword Rankings
Not all ranking positions carry equal value. The difference between position 11 and position 8 is the difference between page two and page one. The difference between position 8 and position 2 is dramatic in terms of click volume.
That is why most experienced SEO teams track keyword counts by position bracket rather than average position alone.
Track how many keywords fall into each of these brackets each month:
- Top 3 positions: highest click share and visibility
- Positions 4 through 10: competitive page one visibility
- Positions 11 through 20: page two, close to page one
- Positions 21 through 50: gaining ground but not yet competitive
- Below position 50: early stage or minimal visibility
Practical example:
A dental practice tracks 60 target keywords. In January, 8 keywords rank in the top 3 and 22 rank in the top 10. By June, 18 keywords rank in the top 3 and 41 rank in the top 10. That shift tells a far more complete performance story than any single average position number.
Section 2: Organic Traffic KPIs
7. Organic Traffic
Organic traffic represents visits that arrive at your website through unpaid search results. It is one of the most fundamental SEO KPIs because it shows whether your search visibility is translating into actual website visits.
Organic traffic tells you which pages are doing real work, which content is declining, where seasonal patterns exist, and how overall search performance is trending.
How to check it:
- In Google Analytics, go to Reports, then Acquisition, then Traffic acquisition.
- Find the Organic Search channel and review sessions or users.
- Check the Landing page report to see which specific pages are receiving organic visitors.
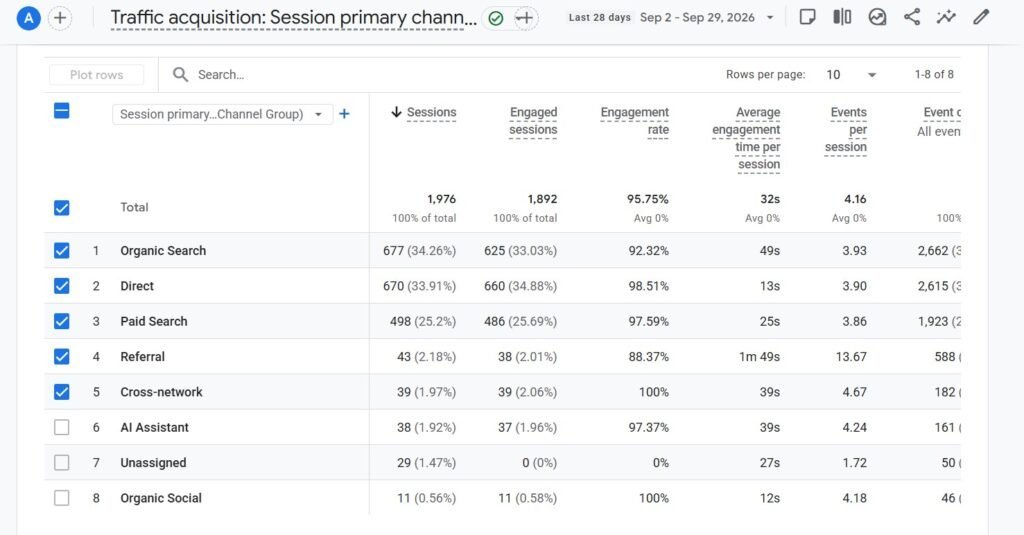
Tracking organic traffic in isolation is not enough. Always connect traffic growth with conversion data. If your Houston HVAC website receives 12,000 organic sessions but generates only 15 phone calls, you have a conversion problem, not a traffic problem.
Key things to monitor alongside organic traffic:
- Which pages drive the most organic sessions
- Month-over-month and year-over-year trends
- Device breakdown between mobile and desktop visitors
- Geographic breakdown for multi-location or service area businesses
8. Non-Branded Organic Traffic
Non-branded organic traffic comes from search queries that do not include your business name. Searches like “auto repair Houston” are non-branded. Searches like “Wise Car Care” are branded.
This distinction matters because non-branded traffic reveals whether your SEO is reaching people who do not already know you exist. A business whose organic traffic growth comes entirely from branded searches may simply be getting more direct traffic. It is not necessarily reaching new audiences.
For a new auto repair shop in Houston trying to grow market share, non-branded organic growth is arguably more important than total organic traffic growth.
How to check it:
- Open Google Search Console and review the Queries report.
- Export query data and separate searches containing your brand name from those that do not.
- Track both sets separately over time.
If total organic traffic grows 40% but non-branded traffic grows only 5%, your content and keyword strategy may need adjustment to reach searchers earlier in their decision process.
9. Organic Click-Through Rate
Organic click-through rate (CTR) shows what percentage of search impressions result in a click to your website. The formula is simple:
Organic CTR equals organic clicks divided by search impressions, multiplied by 100.
If a page receives 12,000 impressions and 480 clicks, its CTR is 4%.
CTR is important because it connects your search visibility to actual traffic. A page with strong rankings and strong impressions but weak CTR is leaving traffic on the table.
Common reasons for low CTR:
- A title tag that does not match the search intent clearly
- A meta description that fails to communicate value or urgency
- Competitors with more compelling titles or review stars showing
- A ranking position too low for most users to scroll to
How to check it:
- Google Search Console shows average CTR across your entire site and for individual queries and pages.
- Look specifically for pages with high impressions and low CTR as your biggest opportunities.
Backlinko’s CTR research consistently shows that the top organic result earns roughly 27% of all clicks. Position three earns roughly 11%. Position ten earns under 3%. Improving CTR even slightly for high-impression pages can produce significant traffic gains.
10. Organic Landing Page Traffic
Organic landing page traffic shows how search visitors enter your website through individual pages. Total organic traffic can mask which pages are actually performing and which are sitting idle.
A service business in Houston might have its homepage, its brake repair page, its oil change page, and a blog post all receiving organic traffic. Knowing the breakdown tells you where to invest additional optimization effort.
How to check it:
- In GA4, open the Landing page report.
- Filter or segment by the Organic Search channel.
- Sort by sessions to see your top entry pages.
Then compare traffic with conversions. A blog post might bring 8,000 organic sessions but generate zero leads. A service page might bring 1,500 sessions and generate 90 leads. Both pages matter, but they serve completely different purposes and require different optimization approaches.
11. Organic Traffic Growth Rate
Organic traffic growth rate measures how quickly your search traffic is increasing or decreasing over time. The formula is:
Growth rate equals current traffic minus previous traffic divided by previous traffic, multiplied by 100.
If organic traffic went from 9,000 sessions to 11,700 sessions, the growth rate is 30%.
How to check it:
- Use GA4 and compare equivalent date ranges.
- For seasonal businesses in Houston, year-over-year comparisons are usually more meaningful than month-over-month.
Comparing September 2026 to September 2025 gives a clearer picture than comparing September to August if your business naturally slows down in late summer. Year-over-year comparisons remove seasonal noise and reveal genuine growth or decline trends.
Section 3: AI Search KPIs
AI-generated search answers are now a real traffic and visibility channel. These five KPIs help you measure your brand’s performance in that emerging landscape.
12. AI Search Visibility
AI search visibility measures how often your brand appears in AI-generated answers across platforms like Google AI Overviews, ChatGPT, Perplexity, and Microsoft Copilot.
Users increasingly ask AI platforms questions they would previously have typed into Google. For a Houston homeowner asking “which HVAC company in Spring Texas has the best reviews,” an AI platform will generate an answer from available web data. If your business appears in that answer, it is your AI search visibility at work.
How to check it:
- Use a dedicated AI visibility monitoring platform.
- Alternatively, create a fixed list of prompts relevant to your services and test them manually across AI platforms.
- Example prompts for a Houston auto repair shop: “best auto repair shop in Houston,” “brake repair near Bear Creek,” “where should I get my oil changed in Katy TX.”
Record whether your brand appears, which competitors appear alongside you, and whether your website is cited as a source.
13. AI Brand Mentions
AI brand mentions count how often your business name appears within AI-generated responses. This is distinct from a citation. The AI can mention your brand name without providing a link to your website.
Brand mentions still carry significant value. An AI response that says “Wise Car Care in Houston is known for honest pricing and fast turnaround” is building brand awareness even without a direct link.
How to track it:
To check your AI visibility, just sign up for a free Microsoft Clarity account and add their quick tracking code to your website.
Once your data starts flowing, simply head over to the AI Visibility dashboard to see exactly how AI bots are interacting with your content!
14. AI Citations
AI citations occur when an AI-generated answer links to or directly references your website as a source. This is more valuable than a simple brand mention because it drives potential referral traffic.
If your article about brake fluid maintenance is repeatedly cited when users ask ChatGPT about brake service, that page is earning AI citation authority for that topic.
How to track it:
Sign in to your Microsoft Clarity project and navigate to the AI Visibility dashboard. From there, select Citations on the left to see exactly which of your web pages are getting cited the most in AI-generated answers and the specific keywords driving that visibility

Pages that earn consistent AI citations often share common traits. They are structured with clear headings, contain direct answers to specific questions, include FAQ sections, and cover topics with genuine depth and expertise. Our SEO services include optimizing your content architecture for exactly these citation signals.
15. AI Referral Traffic
AI referral traffic measures actual visitors arriving at your website from AI-powered platforms. These can come from ChatGPT, Perplexity, Gemini, Claude, and others, depending on how users interact with those tools.
This KPI connects AI visibility to real business impact. An AI mention that sends 500 qualified visitors per month is delivering measurable value in the same way organic search does.
How to check it:
- Open GA4 and review the Acquisition reports.
- Look for referral sessions from AI-related sources in your traffic data.
- Create custom channel groupings in GA4 if needed to cleanly separate AI traffic.
Compare the conversion behavior of AI-referred visitors against your organic search visitors. Research from Semrush found that AI-referred traffic converts at roughly 4.4 times the rate of traditional organic traffic. That makes AI referral traffic one of the highest quality traffic sources available.
16. AI Search Share of Voice
AI search share of voice measures your brand’s presence relative to competitors across a defined set of AI prompts. It answers a specific question: out of all the AI responses generated for your most important topics, how often does your brand appear?
How to track it:
- Create a fixed list of 10 to 20 relevant prompts covering your core service categories and locations.
- Run those prompts across your target AI platforms monthly.
- Record every brand that appears in each response.
- Calculate what percentage of responses include your brand.
Example prompt set for a Houston plumber:
- “best plumber in Houston”
- “emergency plumber Spring TX”
- “who fixes water heaters in Katy Texas”
- “licensed plumber for bathroom remodel Houston”
Tracking this monthly reveals whether your AI visibility is growing or whether competitors are pulling ahead.
Section 4: Content Performance KPIs
17. Organic Traffic per Page
Organic traffic per page tells you which individual pieces of content are actively driving search visitors. Overall organic traffic can hide that two or three pages are doing all the heavy lifting while dozens of others contribute almost nothing.
How to check it:
- Use the GA4 Landing page report filtered by organic search.
- Sort pages by organic sessions.
- Compare traffic against conversion data for each page.
Use this KPI to:
- Identify your top-performing pages for further investment
- Find declining pages that need refreshing or updating
- Discover opportunities to build content clusters around your strongest topics
18. Keyword Coverage
Keyword coverage measures how many relevant search queries your website ranks for across your core topics. A brake service page that ranks for brake repair, brake pads, brake rotors, brake fluid, brake inspection, and brake noise has strong keyword coverage for its topic.
How to check it:
- Open Google Search Console and go to Performance then Queries.
- Export all queries and group them by topic.
- Identify topics where coverage is thin and content opportunities exist.
Strong keyword coverage is a content depth signal that both Google and AI systems use to evaluate topical authority. A Houston roofing company with 40 pages covering roofing topics from every angle will consistently outperform a competitor with three thin roofing pages.
19. New Keywords Acquired
New keyword acquisition tracks the search queries your website begins ranking for during a specific period. It is a leading indicator of content expansion and topical authority growth.
How to track it:
- Use Ahrefs or Semrush to compare keyword rankings between two date ranges.
- Look for terms that appear in the current period but were absent in the previous period.
- Map new keywords to the content pieces or optimizations that triggered them.
New keywords matter because:
- They show your content is expanding into related topics
- They often reveal long-tail opportunities with conversion intent
- They confirm that recent content investments are producing results
20. Content Conversion Rate
Content conversion rate measures how often visitors arriving on your content complete a meaningful business action. That action could be a phone call, a form submission, an appointment booking, a quote request, or a live chat.
The formula is straightforward. Content conversion rate equals conversions divided by organic visitors, multiplied by 100.
A service page receiving 2,400 organic visitors and generating 72 phone calls has a conversion rate of 3%.
How to check it:
- Configure your conversion events correctly in GA4.
- Review the Landing page report filtered by organic search.
- Connect landing page traffic with conversion data for each page.
For our Google Business Profile optimization clients, we consistently find that improving the calls to action and trust elements on service pages raises conversion rate significantly without requiring any additional traffic.
21. Content Engagement Rate
Engagement metrics help you understand whether visitors are actually reading and interacting with your content after arriving from search. In GA4, the key engagement metrics include:
- Engagement rate: the percentage of sessions lasting more than 10 seconds or involving a key event
- Engaged sessions: total sessions meeting the engagement threshold
- Average engagement time: how long users actively interact with your page
- Key events: specific user actions you have configured as meaningful
How to check it:
- Open GA4, then go to Reports, then Engagement.
- Review performance for individual pages.
- Compare engagement metrics across pages with different traffic levels.
A page with 5,000 organic sessions but a 15% engagement rate and 28-second average engagement time is not connecting with its audience. The content may be misaligned with search intent, too thin, or structured in a way that causes visitors to leave immediately.
Section 5: Backlink KPIs
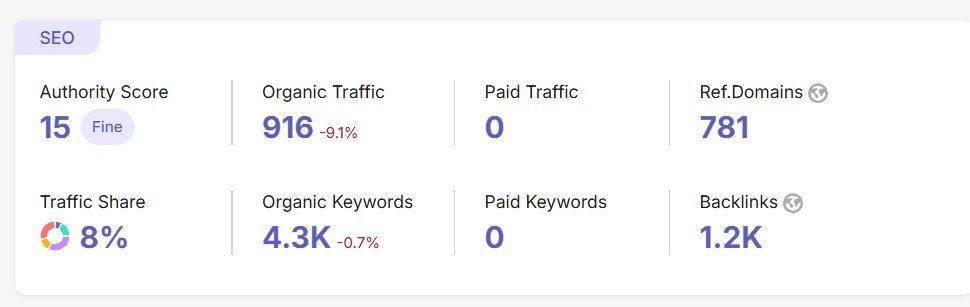
22. Referring Domains
A referring domain is a unique external website that links to your website. If one Houston news website links to you from five different articles, that still counts as one referring domain.
Referring domains matter because they measure the breadth of your backlink profile. A diverse set of relevant referring domains signals to Google that multiple independent sources find your content or business worth referencing.
How to check it:
- Use Ahrefs, Semrush, or Moz to review your referring domain profile.
- Monitor total referring domains, newly acquired domains, and lost domains monthly.
- Evaluate the relevance and authority of the websites linking to you.
What to look for:
- Growth in referring domains over time
- New links from locally relevant Houston area websites
- Loss of referring domains that may indicate link decay
- Low-quality or irrelevant domains that should be disavowed
23. Backlinks
Backlinks are individual links pointing to your website from external sources. The total number of backlinks is less important than the quality, relevance, and diversity of the websites linking to you.
A Houston auto repair shop with 50 backlinks from locally relevant websites, local news outlets, the Better Business Bureau, and industry directories has a stronger backlink profile than a competitor with 2,000 links from unrelated or low-quality sources.
How to check it:
- Use a backlink analysis tool to review total backlinks, new links, lost links, referring domains, and anchor text distribution.
- Pay attention to contextual relevance. A link from a Houston neighborhood publication is worth more than a link from a generic global directory.
24. Link Acquisition Rate
Link acquisition rate measures how quickly your website earns new backlinks or referring domains over a given period. Consistent link acquisition signals to Google that your brand is growing in relevance and authority.
How to track it:
- Record new referring domains and backlinks gained each month.
- Connect spikes in acquisition to specific content pieces, PR campaigns, or outreach activities.
- Use the data to identify which content types or topics earn the most natural links.
Practical example:
Your roofing website earns 4 new referring domains in January, 7 in February, and 14 in March after publishing a comprehensive guide to Texas storm damage insurance claims. That spike tells you clearly which content type earns the most link authority.
25. Brand Mentions
Brand mentions are references to your business name across websites, social platforms, forums, and online communities. They can be linked or unlinked.
Both types carry value. Linked mentions provide direct link equity. Unlinked mentions contribute to your brand entity recognition in Google’s knowledge graph and in the training data that AI systems use.
How to track it:
- Set up a Google Alert for your business name and common variations.
- Use a brand monitoring tool for more comprehensive coverage.
- Look for unlinked mentions as link reclamation opportunities.
For a local service business, brand mentions on Nextdoor, community Facebook groups, local news comment sections, and Houston area blogs all contribute to your overall brand authority. Monitoring these keeps you informed and creates opportunities to engage with your audience where they are talking about you.
Section 6: Technical SEO KPIs
26. Core Web Vitals
Core Web Vitals are Google’s official page experience metrics. They measure specific aspects of how your pages load, respond, and behave visually. The three primary metrics are:
- Largest Contentful Paint (LCP): how quickly the main visible content loads
- Interaction to Next Paint (INP): how quickly your page responds to user interactions
- Cumulative Layout Shift (CLS): how much page elements move unexpectedly while loading
Google uses Core Web Vitals as a ranking signal. Pages that fail these metrics face a competitive disadvantage, particularly on mobile, where most Houston area local searches happen.
How to check it:
- Open Google Search Console, then go to Experience, then Core Web Vitals.
- Use PageSpeed Insights to test individual pages.
- Use Screaming Frog with a PageSpeed API integration to audit your entire site at once.
Common Core Web Vitals problems for local service websites:
- Uncompressed hero images slowing LCP scores
- Third-party scripts delaying INP responses
- Unstable ad placements or lazy-loaded images causing CLS
Fixing Core Web Vitals on your most important service pages often produces ranking improvements within weeks of the fixes being validated by Google.
27. Indexed Pages
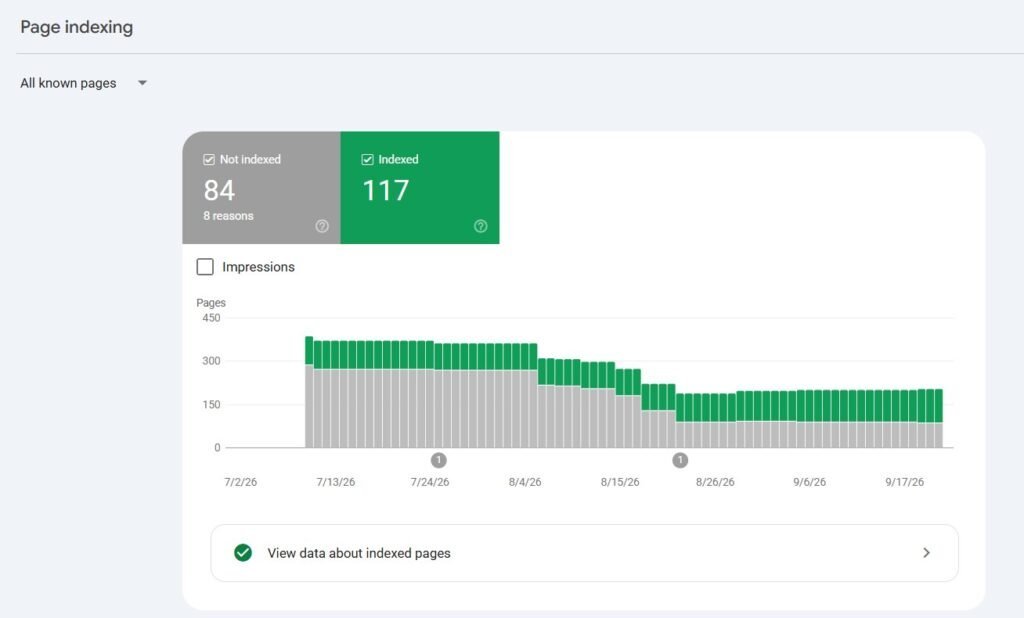
Indexed pages are the URLs on your website that Google has added to its index and can display in search results. A page that is not indexed cannot rank for anything, regardless of how well it is optimized.
Tracking your indexed page count helps you confirm that important content is visible to Google and that low-value or duplicate pages are not being indexed unnecessarily.
How to check it:
- Open Google Search Console, then go to Indexing, then Pages.
- Review the number of indexed pages and the list of non-indexed URLs.
- Use the URL Inspection tool to check specific pages.
Common indexing problems:
- Pages blocked by robots.txt or noindex tags accidentally
- Duplicate content causing Google to choose one version over another
- Thin or low-value pages that Google deprioritizes for indexing
- New pages that have not yet been crawled and discovered
28. Crawl Errors
Crawl errors occur when search engine bots try to access a URL on your website but encounter a problem. Common crawl errors include:
- 404 errors for pages that no longer exist
- 5XX server errors indicating server-side problems
- Redirect chains or redirect loops slowing crawling
- Resources blocked from crawling that are needed to render pages
Crawl errors on important pages can prevent them from ranking or cause them to lose existing rankings over time.
How to check it:
- Use Google Search Console, then go to Indexing, then Pages to identify problem URLs.
- Crawl your entire website with Screaming Frog SEO Spider to find broken links, redirect chains, and server errors.
- Fix errors in order of priority, starting with broken pages that have existing backlinks or internal links pointing to them.
Section 7: Conversion and Revenue KPIs
29. Organic Conversion Rate
Organic conversion rate measures how effectively your search visitors complete a desired action. For local service businesses, this typically means phone calls, form submissions, appointment bookings, or quote requests.
The formula is:
Organic conversion rate equals organic conversions divided by organic sessions, multiplied by 100.
Organic Conversion Rate = (Organic Conversions / Organic Sessions) × 100
A website receiving 8,000 organic sessions and generating 240 leads has an organic conversion rate of 3%.
How to check it:
- First, configure your most important conversion events in GA4. These might include form submissions, phone call link clicks, chat interactions, and appointment completions.
- Then review the Acquisition reports to see how organic search visitors are converting compared with other channels.
- Compare conversion rates by landing page to identify which pages convert well and which need improvement.
What conversion rate benchmarks look like for local service businesses:
A conversion rate below 1% usually signals a landing page problem. Rates between 2% and 4% are typical for well-optimized local service pages. Rates above 5% usually indicate strong intent alignment, clear calls to action, and genuine trust signals on the page.
Traffic growth is useful and necessary. But conversion rate improvement often delivers faster revenue impact per dollar invested than traffic growth alone.
30. SEO Revenue and ROI
SEO revenue connects your entire organic search effort to actual business income. This is the KPI that every business owner ultimately cares about, and it is the one that most SEO reports fail to address clearly.
For ecommerce businesses, SEO revenue can be tracked directly through online purchases attributed to organic search. For service businesses, it requires connecting organic leads with your sales data.
A basic SEO ROI formula is:
SEO ROI equals revenue from SEO minus SEO cost divided by SEO cost, multiplied by 100.
SEO ROI = ((Revenue from SEO – SEO Cost) / SEO Cost) × 100
If your monthly SEO investment is $3,000 and you attribute $12,000 in revenue to organic search, your SEO ROI is 300%.
How to calculate it for service businesses:
- Track how many organic leads you receive each month.
- Estimate your average close rate on leads from your CRM or lead tracking system.
- Multiply closed deals by your average customer value to get attributable revenue.
- Connect that revenue figure to your monthly SEO investment.
What to avoid:
- Treating every lead as equal. A $200 oil change customer is very different from a $4,000 transmission replacement.
- Attributing all website revenue to SEO when multiple channels contributed.
- Looking only at month one. SEO revenue compounds over time as rankings and authority build.
How to Choose the Right SEO KPIs for Your Business
You do not need to report all 30 KPIs every month. That would create noise, not clarity.
Start with your primary business goal and work backward. Your goal determines which KPIs deserve the most attention.
If your goal is increasing organic traffic:
- Organic search visibility
- Keyword rankings, particularly top 3 and top 10 counts
- Search impressions and CTR
- Non-branded organic traffic growth rate
If your goal is lead generation:
- Organic conversion rate
- Organic landing page traffic for key service pages
- Brand mentions and referring domains supporting those pages
- Phone calls and form submissions from organic sessions
If your goal is local market dominance:
- Local pack visibility for your core service keywords
- Google Business Profile interactions including calls and direction requests
- Top 10 rankings for location-specific queries
- Share of search against local competitors
If your goal is AI search visibility:
- AI search visibility across target prompts
- AI brand mentions and citations
- AI referral traffic and its conversion behavior
- AI share of voice versus competitors
For most local service businesses in Houston, a practical monthly report covers 8 to 12 KPIs drawn from across these categories. A dashboard that makes performance immediately understandable is far more valuable than one packed with every available metric.
Leading vs Lagging SEO KPIs
Understanding the difference between leading and lagging KPIs helps you set realistic expectations and interpret performance data correctly.
Leading indicators provide early signals of progress:
- Keyword rankings moving upward
- Impressions increasing
- Search visibility growing
- New backlinks and referring domains acquired
- AI brand mentions increasing
- Core Web Vitals improving
These numbers tell you your strategy is working before the business results fully materialize.
Lagging indicators show the business outcome:
- Organic leads and form submissions
- Phone calls from organic search
- Revenue attributed to organic search
- Customer acquisition from SEO
- SEO ROI
For example, if your goal is increasing organic leads by 35% over six months, your leading indicators should improve first. Rankings move up in months one and two. Traffic grows in months two and three. Conversions increase in months three through six. Watching leading indicators helps you confirm the strategy is on track before the final business outcome is visible.
How Often Should You Review SEO KPIs?
Different KPIs require different review frequencies. Reviewing everything daily creates noise. Reviewing everything quarterly leaves you blind to problems that could compound for weeks.
Daily monitoring should focus on:
- Major traffic drops that could indicate a penalty or technical issue
- Website errors or outages
- Sudden ranking changes for your most important keywords
Weekly reviews should include:
- Organic traffic trends for the current period
- Rankings for your 10 to 15 most important keywords
- Any new crawl errors flagged in Search Console
Monthly reporting should cover:
- Full organic traffic analysis with year-over-year comparisons
- Ranking progress across your full keyword set
- CTR performance and opportunities
- Conversion rate by landing page
- Backlink and referring domain growth
- AI visibility and citation tracking
- Core Web Vitals status
- Content performance highlights
Quarterly strategic reviews should address:
- Revenue and ROI attribution
- Competitor performance analysis
- Content strategy assessment
- Technical SEO audit findings
- AI search share of voice trends
Build an SEO KPI Dashboard
A strong SEO dashboard makes performance easy to understand at a glance. Your client or your leadership team should not need to open five different tools to understand whether SEO is working.
A practical dashboard for a local service business could include:
- Organic traffic versus the same period last year
- Top 10 keyword count this month versus last month
- Organic conversion rate and total organic leads
- Google Business Profile interactions: calls, direction requests, website clicks
- Backlinks and referring domains gained this month
- AI visibility tracking for key prompts
- Core Web Vitals status for key pages
- SEO revenue and ROI calculation
Tools that work well for building this dashboard:
- Google Analytics 4 for traffic and conversion data
- Google Search Console for rankings and impressions
- Looker Studio for pulling multiple data sources into one visual report
- Ahrefs or Semrush for backlink and keyword tracking
- BrightLocal for local search visibility and GBP performance
The best dashboard is the one your team actually uses and understands. Keep it focused on decisions, not data dumps.
How to Set SEO KPI Targets
Targets should start from your current baseline. Setting a target in isolation without knowing where you start is guesswork.
Gather at least three months of baseline data before setting targets. Look at your current organic traffic, conversion rate, keyword counts, and referring domains. Then set targets that reflect realistic growth given your industry, competition level, website maturity, and investment level.
A practical example for a auto repair shop:
Current baseline:
- 4,200 monthly organic sessions
- 18 keywords in the top 10
- 2.1% organic conversion rate
- 88 organic leads per month
Six-month targets:
- 6,500 monthly organic sessions (55% growth)
- 35 keywords in the top 10
- 2.8% organic conversion rate
- 180 organic leads per month
These targets have a clear direction, a realistic growth expectation based on historical data, and a direct connection to business outcomes. They use both leading indicators like keyword counts and lagging indicators like organic leads.
Revisit and adjust targets quarterly. SEO performance can outpace initial projections when a site is in an early growth phase or fall short during highly competitive periods. Flexibility in targets is realistic, not a sign of failure.
Common SEO KPI Mistakes
Avoiding these mistakes will save you significant time and keep your reporting focused on what actually matters.
Tracking too many KPIs at once. A monthly report with 45 numbers is harder to act on than one with 10 carefully chosen indicators. More data does not automatically mean better decisions.
Focusing only on rankings. Rankings tell you where you sit. They do not tell you whether that position is generating traffic, leads, or revenue. Always connect rankings with clicks, CTR, and conversions.
Confusing branded and non-branded traffic. A surge in branded search can inflate organic traffic without indicating any real SEO progress. Always separate these two traffic types in your analysis.
Judging backlinks by quantity alone. Fifty high-quality, locally relevant backlinks from Houston publications and industry directories are worth more than 5,000 links from low-quality foreign directories. Quality and relevance determine backlink value.
Ignoring AI search in your reporting. Traditional organic search remains important and will remain important. But AI-generated answers are creating a parallel visibility channel that is already driving traffic and leads for businesses that appear in them. Excluding AI KPIs from your reporting in 2026 means ignoring a growing traffic source.
Not setting a baseline before setting targets. Targets without baseline data are arbitrary. Always know where you start before defining where you want to go.
Reviewing KPIs too infrequently. Monthly reporting is the minimum for an active SEO campaign. Quarterly-only reviews allow problems to compound and opportunities to expire before anyone notices.
Final Thoughts: Track What Actually Moves Your Business Forward
SEO KPIs help you understand what is really happening behind your search performance.
Rankings show where your pages appear. Impressions and CTR show how users interact with your search listings. Organic traffic shows whether visibility is translating into visits. Conversions and revenue show whether those visits are creating actual business value. AI search KPIs show whether your brand is being cited and recommended in the next generation of search tools.
The goal is not to track all 30 KPIs every single month. The goal is to choose the indicators that match your website, your business model, and your specific growth objectives. Review them consistently. Compare data across meaningful time periods. Use the numbers to make decisions, not just to fill a report.
A great SEO report should answer more than whether your rankings improved. It should confirm whether your SEO work is increasing visibility, attracting the right audience, generating meaningful actions, and contributing directly to business growth.